Interobserver delineation variability of computed tomography-based radiomic features of the parotid gland
Article information

Abstract
Purpose
To assess the interobserver delineation variability of radiomic features of the parotid gland from computed tomography (CT) images and evaluate the correlation of these features for head and neck cancer (HNC) radiotherapy patients.
Materials and Methods
Contrast-enhanced CT images of 20 HNC patients were utilized. The parotid glands were delineated by treating radiation oncologists (ROs), a selected RO and AccuContour auto-segmentation software. Dice similarity coefficients (DSCs) between each pair of observers were calculated. A total of 107 radiomic features were extracted, whose robustness to interobserver delineation was assessed using the intraclass correlation coefficient (ICC). Pearson correlation coefficients (r) were calculated to determine the relationship between the features. The influence of excluding unrobust features from normal tissue complication probability (NTCP) modeling was investigated for severe oral mucositis (grade ≥3).
Results
The average DSC was 0.84 (95% confidence interval, 0.83–0.86). Most of the shape features demonstrated robustness (ICC ≥0.75), while the first-order and texture features were influenced by delineation variability. Among the three observers investigated, 42 features were sufficiently robust, out of which 36 features exhibited weak correlation (|r|<0.8). No significant difference in the robustness level was found when comparing manual segmentation by a single RO or automated segmentation with the actual clinical contour data made by treating ROs. Excluding unrobust features from the NTCP model for severe oral mucositis did not deteriorate the model performance.
Conclusion
Interobserver delineation variability had substantial impact on radiomic features of the parotid gland. Both manual and automated segmentation methods contributed similarly to this variation.
Introduction
Radiomics is a field of medical imaging that involves the extraction of quantitative features from medical images. These features offer valuable insights into tissue characteristics, such as heterogeneity, uniformity, and shape, enabling the prediction of treatment response and treatment-related toxicity [1,2]. The radiomic workflow involves image acquisition, segmentation of regions-of-interest (ROIs), extraction of radiomic features, and optional feature selection for subsequent analysis [3,4]. With the advancement of machine learning capabilities, predictive models leveraging radiomic features as input data have garnered significant research interest [1]. However, the reliability of these radiomic features remains a challenge and necessitates careful assessment prior to clinical application. This includes assessing the reliability due to factors, such as image acquisition, image reconstruction, image processing, and image segmentation [5]. Each step involved in extracting radiomic features presents its own challenges, and variations at any stage can affect feature reliability. Among these steps, interobserver delineation variability is particularly critical since features are derived from ROIs identified during segmentation [6]. Any variability in segmentation can affect subsequent analysis and utilization of the features. Therefore, accurate delineation of ROIs is essential to ensure the integrity of the results.
During radiotherapy for head and neck cancer (HNC), the parotid gland is often exposed to radiation, which can result in radiation-induced toxicity, for example, xerostomia and oral mucositis, which adversely affect the quality of life of patients [7]. Extracting radiomic features from the parotid gland have shown potential in predicting radiation-induced toxicity in HNC patients, aiding physicians in treatment planning guidance [8–11]. For example, Sheikh et al. [9] conducted an analysis of computed tomography (CT)- and magnetic resonance-based radiomic features of the parotid gland, along with clinical and dose-volume histogram (DVH) features, to predict xerostomia in HNC patients. They employed generalized linear regression to generate a predictive model and compared the performance of different models. The results indicated that the model incorporating both clinical and radiomic features exhibited superior performance (area under the curve [AUC] = 0.73) in predicting xerostomia compared to models comprising only DVH features (AUC = 0.63) or the combination of DVH, radiomic, and clinical features (AUC = 0.68). These findings suggested that early prediction of xerostomia could be achieved without relying on dosimetric features.
For the development of a predictive model of treatment outcomes, it is crucial to identify predictors with minimal interobserver variability as they can be directly derived from the clinical data. Several studies have explored the impact of delineation uncertainties on the variability of radiomic features [12–17]. These studies have covered a range of tumor sites, such as cervical cancer [12,13], non-small cell lung cancer (NSCLC) [14,15], oropharyngeal cancer [16], and pancreatic cancer [17]. However, most of these investigations focused on tumor delineation and have not extensively explored the interobserver delineation variability of radiomic features in organs-at-risk, particularly the parotid gland. One of those studies investigating the robustness of parotid gland radiomic features is, for example, Forde et al. [18], who examined the interobserver variability of 42 radiomic features extracted from the right parotid gland (n = 40) and found that delineation variability among observers had significant impact on the values of these radiomic features. These findings underlined the importance of considering interobserver variability when extracting radiomic features from parotid gland contours, as it could influence the reliability and clinical utility of these features, such as in treatment outcome modeling.
To our knowledge, robustness of radiomic features extracted from the combined left and right parotid glands of HNC patients using CT-contrast images has not been investigated. These features hold particular relevance for modeling normal tissue complication probability (NTCP) in HNC radiotherapy [11]. Furthermore, artificial intelligence (AI)-based auto-segmentation has become of increasing interest in the clinic [19]. It is therefore of interest to evaluate the interobserver delineation variability of the combined parotid glands through manual segmentation by different ROs and an AI-based auto-segmentation program. In addition to assessing the reliability of radiomic features concerning interobserver variability, it is important to examine the correlation between these features before incorporating them into a predictive model. Highly correlated features should be carefully considered, as selecting only one of them can help prevent multicollinearity, redundancy, and instability in the model.
The objective of this study was to investigate the interobserver delineation variability of CT-based radiomic features extracted from parotid gland contours of HNC patients undergoing radiotherapy. The study also aimed to assess the correlation of the extracted radiomic features, as a part of the feature selection process in treatment outcome modeling. Finally, the influence of excluding insufficiently robust features from NTCP modeling on the model performance was investigated using severe oral mucositis (grade ≥3) as the test endpoint.
Materials and Methods
1. Patient data
Retrospective data of HNC patients who underwent intensity-modulated radiation therapy and volumetric modulated arc therapy between 2017 and 2022 were included in this study. Note that only patients with CT images free from artifacts were included. From the initial pool of 200 patients, 20 patients were randomly selected for the interobserver reliability test. The CT images were acquired during the simulation stage, and the original delineations of the parotid glands were manually performed during the planning stage by the treating radiation oncologists (ROs) with 3–13 years of experience. To evaluate interobserver variations, additional manual delineations of the parotid glands were conducted by a selected RO with 15 years’ experience using Eclipse treatment planning system version 13.6 (Varian Medical Systems, Palo Alto, CA, USA), and automated delineations were performed using AccuContour AI-assisted Auto-delineation Tool version 3.1 (Manteia Data Technologies Ltd., Milwaukee, WI, USA).
2. Radiomic analysis
The right and left parotid glands were merged into a single structure for the purpose of feature extraction. Radiomic features were extracted using AccuContour. The CT gray intensity bin width was set at 25 Hounsfield units. A total of 107 radiomic features were extracted from the combined parotid glands as shown in Table 1, comprising 14 shape, 18 first-order, and 75 texture features. The texture features were further categorized into five groups, including 24 gray-level co-occurrence matrix (GLCM) features, 16 gray-level run length matrix (GLRLM) features, 16 gray-level size zone matrix (GLSZM) features, 14 gray-level dependence matrix (GLDM) features, and five neighborhood gray-tone difference matrix (NGTDM) features.

The radiomic features extracted from the parotid gland using AccuContour
3. Dice similarity coefficients
Statistical analysis was performed using MATLAB R2022b (MathWorks Inc, Natick, MA, USA). The Dice similarity coefficient (DSC) was used to measure the similarity of the parotid gland contours among different observers for the same patient. The DSC is a measure that ranges from 0 (indicating no overlap) to 1 (indicating perfect overlap) [20]. The DSC is calculated from
where A and B represent the volumes of the organ delineated by two different observers, and ∩ denotes the intersection of the two volumes. In this study, three DSC tests were performed to compare the contours by pairs of observers, as shown in Fig. 1. The first test involved comparing the treating ROs with a selected RO (Test 1). The second test compared treating ROs with auto-segmentation (Test 2). Finally, the third test compared the selected RO with auto-segmentation (Test 3). The Wilcoxon signed-rank test was used to measure the statistical difference of DSCs obtained from these different tests. An alpha level of 0.05 was used for all statistical analyses.

The schematic for the investigation of interobserver delineation variability of parotid glad radiomic features based on Dice similarity coefficient (DSC) and intraclass correlation coefficient (ICC), and the correlation analysis of the radiomic features. RO, radiation oncologist.
4. Intraclass correlation coefficients
The intraclass correlation coefficient (ICC) was selected as the metric to assess the robustness of radiomic features in relation to interobserver variability [21]. The ICC was calculated using the formula for two-way random effects, absolute agreement, single rater (observer), or ICC(2,1). This ICC form is suitable when the observers are randomly selected from a larger population of observers with similar characteristics, and in the actual application the ROI contour for a patient will be delineated by a single observer, namely, the treating RO. The ICC was calculated according to [22]:
where MSR is the mean square between subjects, MSC is the mean square between observers, MSE is the mean square for error, n is the number of subjects, and k is the number of observers. The level of robustness was classified according to the criteria proposed by Koo and Li [22] into poor (ICC < 0.5), moderate (0.5 ≤ ICC < 0.75), good (0.75 ≤ ICC < 0.9), and excellent (ICC ≥ 0.9). For the treatment outcome modeling, features with ICC of ≥ 0.75 is considered sufficiently robust [22].
In this study, four interobserver reliability tests were performed as shown in Fig. 1. Tests 1–3 compared the contours made by two observers, i.e., in accordance with the DSC tests, and Test 4 compared the contours from all three observers at once (treating ROs, a selected RO, and auto-segmentation). Also, the Wilcoxon signed-rank test was used to measure the statistical difference of the ICCs obtained from the different tests.
The Pearson correlation coefficient (r) was calculated to measure the linear association between radiomic features, as follows:
where Xi and Yi are two features of the subject i, for which r is calculated, and
5. NTCP modeling
Although unrobust radiomic features should not be used in a predictive model as they may produce inconsistent and unreliable prediction, it was also of interest whether the exclusion of insufficiently robust features would influence the NTCP model performance. For this reason, we performed machine learning-based NTCP modeling by using clinical data, and dosimetric and radiomic information of the parotid gland for predicting severe oral mucositis (grade ≥3) at any time during the radiotherapy treatment course and within 1 month after radiotherapy. The first modeling approach used all radiomic features, while the second modeling approach used only features that were considered sufficiently robust. Pearson correlation of the features was used for both modeling approaches to reduce feature redundancy. Then, the minimum redundancy maximum relevance (MRMR) algorithm and the model-based random forest (MBRF) algorithm based on the permutation feature importance were used for feature selection. Logistic regression was used as the machine learning algorithm. The NTCP model performance in terms of accuracy, the AUC, sensitivity, specificity, precision and F1-score was compared between the modeling approaches that included all radiomic features and only sufficiently robust features. For NTCP modeling, the cohort of 200 HNC patients was divided into 160 (80%) and 40 (20%) for training and testing, respectively. The training dataset was further divided equally into five datasets. Four datasets were used for training and five-fold cross-validation, while the remaining dataset was used for model testing. A set of features that performed best in term of F1-score during the five-fold cross-validation was used in the final model. Finally, the model performance was evaluated using the test dataset.
Results
1. Dice similarity coefficients
Fig. 2 shows the examples of manully delineated parotid gland contours by two ROs and contours automatically generated by AccuContour. Fig. 3 presents the DSCs obtained from each pairwise comparison. The average DSC from all comparisons was 0.84, with the 95% confidence interval of [0.83, 0.86]. The contours delineated by the treating ROs and the selected RO exhibited highest similarity, as reflected by the highest average DSC. However, the statistical test indicated that only the DSCs from Tests 1 and 3 were significantly different (p = 0.05). In these tests, the contours created by the selected RO were compared to either the treating ROs or auto-segmentation.
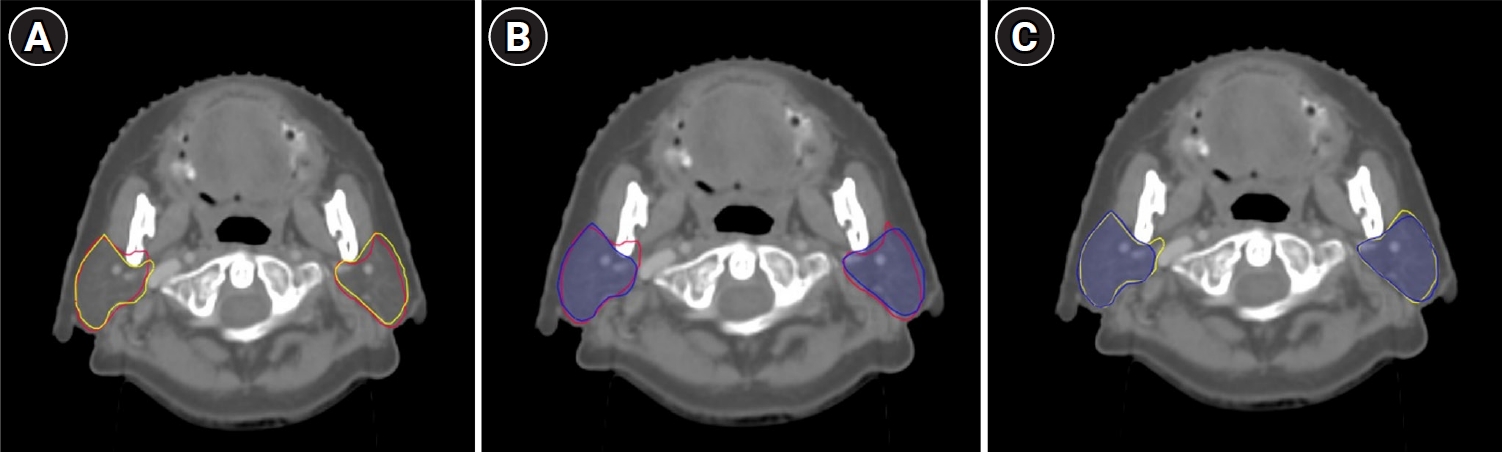
Axial computed tomography images of a patient with the parotid gland contours made by different observers. (A) The treating RO (red line) vs. the selected RO (yellow line), resulting in the DSC of 0.86. (B) The treating RO (red line) vs. auto-segmentation (blue line), resulting in the DSC of 0.84. (C) The selected RO (yellow line) vs. auto-segmentation (blue line), resulting in the DSC of 0.84. RO, radiation oncologist; DSC, Dice similarity coefficient.

The box plots depicting the Dice similarity coefficients (DSCs) for contours delineated by the treating ROs, the selected RO, and AccuContour auto-segmentation software. The description of each test is shown in Fig. 1. The box edges represent the 25th and 75th percentiles, the central lines represent the median values, and the cross symbols in the boxes represent the mean values, which are 0.85, 0.84, and 0.83 in Tests 1–3, respectively. RO, radiation oncologist.
2. Intraclass correlation coefficients
Tables 2–5 shows the robustness levels of the radiomic features as classified by the ICC values from the different tests. The analysis revealed that, out of 107 features, 37.4%–45.8% of the features were sufficiently robust (ICC ≥ 0.75) in all tests, with the highest number of robust features found in Test 3. Moreover, 85.7%–92.9% of the shape features demonstrated excellent or good robustness in all tests, while only 33.3%–44.4% of the first-order features and 26.7%–38.7% of the texture features were sufficiently robust in all tests.

Robustness of features extracted from the parotid gland contours delineated by treating ROs versus a selected RO (Test 1)

Robustness of features extracted from the parotid gland contours delineated by treating ROs versus auto-segmentation (Test 2)

Robustness of features extracted from the parotid gland contours delineated by a selected RO versus auto-segmentation (Test 3)

Robustness of features extracted from the parotid gland contours delineated by treating ROs, a selected RO, and auto-segmentation (Test 4)
Fig. 4 compares the ICC values obtained from Tests 1–4 for different classes of radiomic features. Table 6 provides the corresponding p-values derived from the Wilcoxon signed-rank test. For all radiomic features, the ICCs from Tests 1 and 2 and those from Tests 1 and 3 were found to be significantly different (p = 0.046 and 0.004, respectively). However, when analyzing individual feature class, most classes did not show significant differences, except for the GLCM and GLSZM texture features. In these classes, significant differences of the ICCs were identified between Tests 1 and 3 (p = 0.047 and 0.040, respectively).

The intraclass correlation coefficients (ICCs) of the radiomic features extracted from parotid gland contours: (A) shape features, (B) first order features, (C) texture features (GLCM), (D) texture features (GLRLM), (E) texture features (GLSZM), (F) texture features (GLDM), and (G) texture features (NGTDM). The dashed lines mark the ICC of 0.75, considered as the threshold for sufficient robustness. GLCM, gray-level co-occurrence matrix; GLRLM, gray-level run length matrix; GLSZM, gray-level size zone matrix; GLDM, gray-level dependence matrix; NGTDM, neighborhood gray-tone difference matrix; RO, radiation oncologist.

P-values from the Wilcoxon signed-rank test for the comparison of the ICCs obtained from two different tests
3. Pearson correlation analysis
From all robust features found in Test 4 (42 features), the Pearson correlation coefficients between the features were calculated as shown in Fig. 5. The correlation coefficients were calculated for the features that were extracted from the contours generated by the treating ROs. Among 861 feature pairs assessed, 106 pairs showed strong positive correlation (r ≥ 0.8) and 57 pairs strong negative correlation (r ≤ -0.8). To avoid feature redundancy, one feature was dropped out from each strongly correlated pair. As a result, 36 (33.6%) robust radiomic features of the parotid gland could be used for the development of a predictive model. Table 7 shows the final list of the radiomic features found to be robust and not strongly correlated.
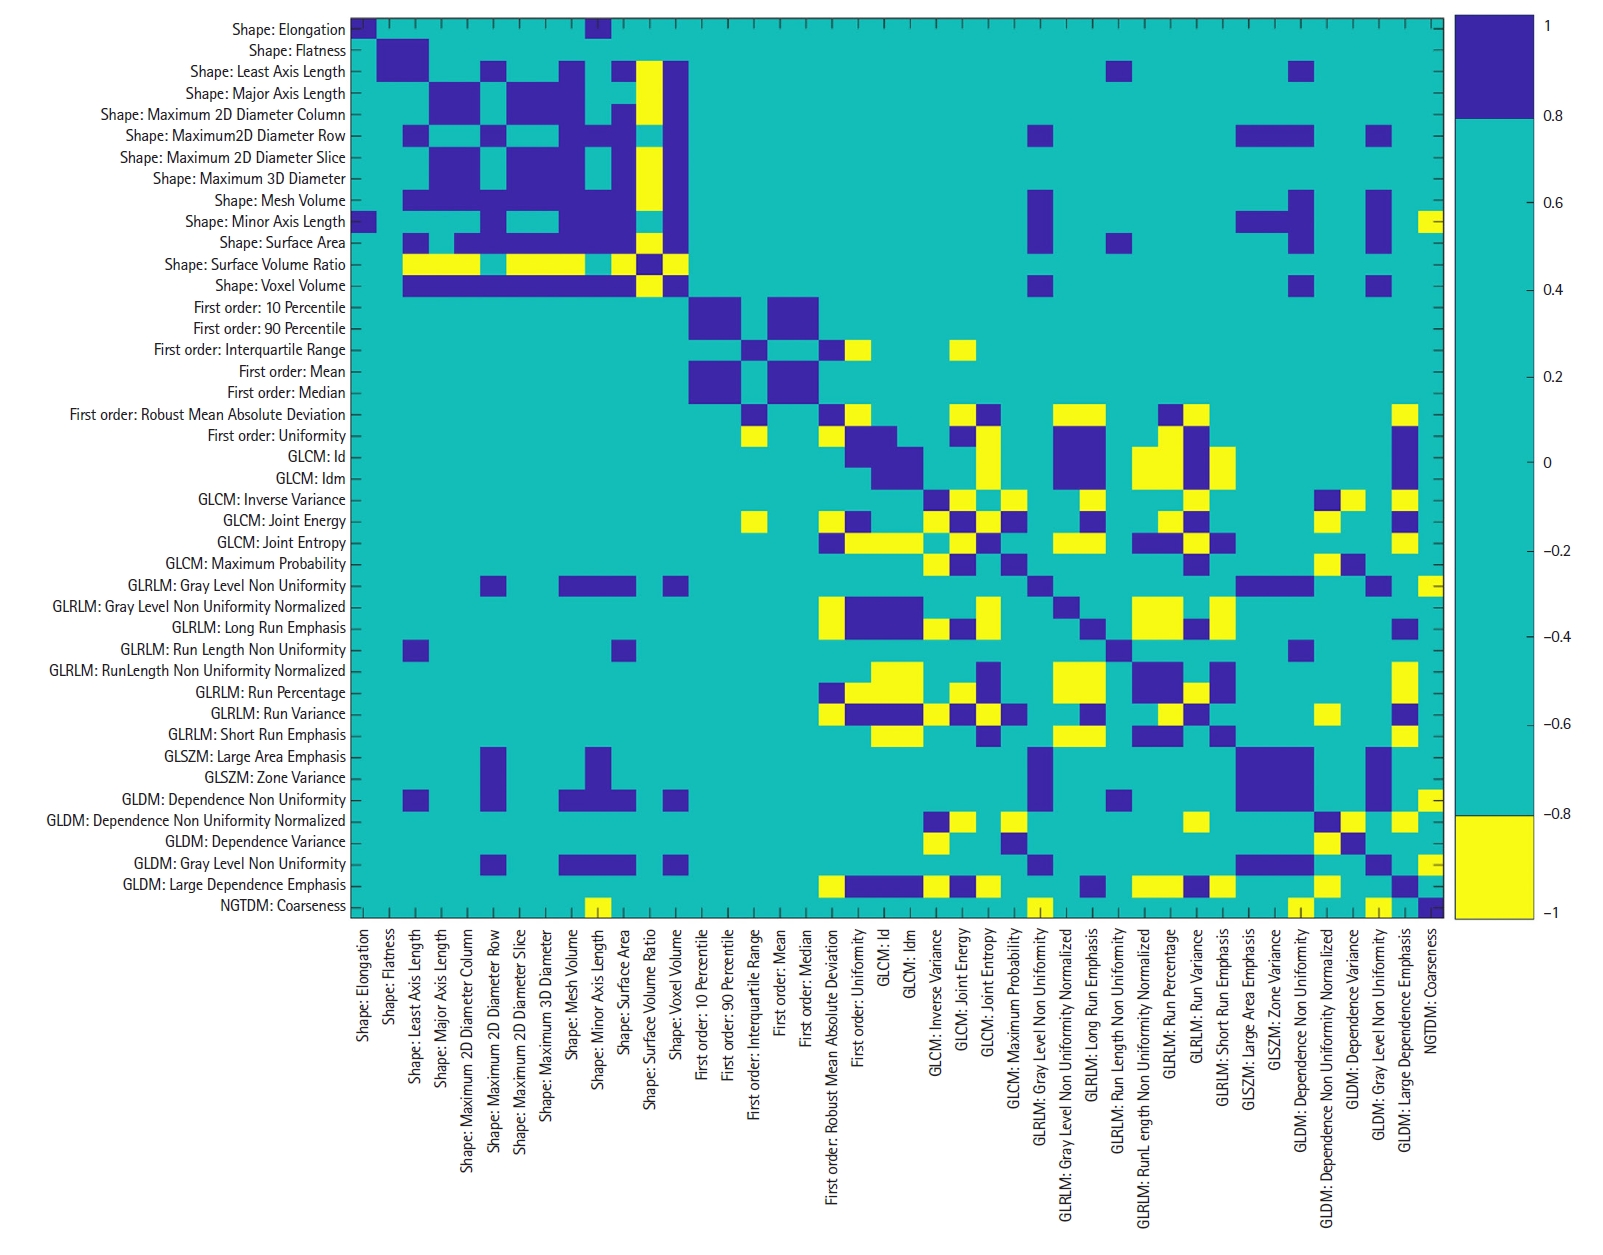
The Pearson correlation matrix for the robust radiomic features extracted from the parotid gland contours delineated by the treating ROs. Blue and yellow indicate strong positive and negative correlation, respectively, while green indicates weak correlation. GLCM, gray-level co-occurrence matrix; GLRLM, gray-level run length matrix; GLSZM, gray-level size zone matrix; GLDM, gray-level dependence matrix; NGTDM, neighborhood gray-tone difference matrix; RO, radiation oncologist.

List of features found to be robust and not strongly correlated
4. NTCP model performance
Table 8 summarizes the NTCP model performance for predicting severe oral mucositis (grade ≥3) at any time during the radiotherapy treatment course and within 1 month after radiotherapy. Using the MRMR feature selection algorithm, 14 common features were selected for both modeling approaches based on all radiomic features and only those considered sufficiently robust, i.e., no radiomic features that did not pass the robustness test were selected in the MRMR feature selection algorithm. As a result, the model performance for both modeling approaches was the same. Using the MBRF feature selection algorithm, 35 features were selected for the modeling approach that included all radiomic features, while 21 features were selected when only sufficiently robust features were included. The model that was derived from only sufficiently robust radiomic features showed better performance than the model that included all radiomic features in all aspects investigated.

The NTCP model performance for predicting severe oral mucositis (grade ≥3) at any time of the radiotherapy treatment course and within 1 month after radiotherapy
Discussion and Conclusion
This study focused on assessing the robustness of radiomic features of parotid glands in 20 HNC radiotherapy patients in relation to the delineation variability between treating ROs (clinical data), a selected RO and AI-based auto-segmentation. DSCs are commonly used to compare contours made by different observers. In this study, we found that the mean DSCs from the different tests exceeded the recommended threshold of 0.7 [25] and were in the same range as found in other similar studies [18,26,27]. However, from this segmentation variation approximately 60% of the extracted radiomic features were found to be insufficiently robust. Although standardized guidelines and protocols for parotid gland segmentation have been established [28], the differences in observers’ experience and subjective interpretation of anatomical boundaries of the gland contributed to segmentation variations, therefore impacting the robustness of radiomic features extracted from parotid gland contours in contrast-enhanced CT images.
In this study, we found that most of the shape features were sufficiently robust, while the majority of the radiomic features that exhibited moderate or poor robustness (ICC ≤ 0.75) belonged to the first-order and texture features classes. This finding contrasted with the study conducted by Forde et al. [18], which utilized paired percentage difference and identified the GLRLM texture feature class as the most robust features. First-order features refer to basic statistical properties of the ROI, such as the maximum and minimum intensities. The relatively poor robustness of these features had an impact on the other related features within the same class, such as Range (the difference between maximum and minimum intensity values), Energy (the sum of squared pixel intensities in the ROI), and Variance (a measure of pixel intensity variability within the ROI).
One of the reasons why some of the radiomic features were not robust was the anatomy of interest, i.e., the parotid gland, which is surrounded by relatively high tissue inhomogeneity. The neighboring structures, such as the vessels, bones, and other adjacent tissues of the ROI, could introduce noises and potentially lead to the lack of robustness of some of the radiomic features. As a result, the delineation variability could amplify the variability of the radiomic features of the parotid gland, compared to organs located in the area of less tissue inhomogeneity. Despite using the same delineation protocol and treatment planning system, the differences in parotid gland contouring could arise from the window width and level used during contouring.
In the study conducted by Owens et al. [15] for NSCLC, the radiomic features extracted from contrast-enhanced CT scans were found to be susceptible to the variability in manual segmentation across all feature classes. However, different semi-auto-segmentation programs tended to show greater stability in interobserver reproducibility compared to manual segmentation. In our study, we discovered that for each feature class the robustness levels were not significantly different for all the tests involving the treating ROs (i.e., the raw clinical data) compared to other observers (Tests 1, 2, and 4 in Table 6). This result suggested that additional contours generated by auto-segmentation or a selected group of ROs to the available clinical data should not change the robustness level of the radiomic features. This finding is particularly relevant when additional auto- or manually segmented contour data is acquired and added to existing clinical data.
Among all the features examined, a strong correlation was observed among the majority of the shape features, while the first-order and texture features demonstrated either independence or weak correlations. After excluding each of the strongly correlated features, only 33.6% of the features remained robust and weakly correlated. These features can be used to build predictive models of treatment outcomes.
The robustness test is considered to be one of the feature selection processes for NTCP modeling. However, it was also of interest whether the exclusion of unrobust features would deteriorate the NTCP model performance. For this reason, we conducted a preliminary study by using clinical, dosimetric and radiomic information of the parotid gland for NTCP modeling for oral mucositis. As exemplified in this study, exclusion of insufficiently robust features of the parotid gland did not necessarily deteriorate the NTCP model performance. In particular, using only robust features may lead to an improved model performance compared to using all features. Therefore, robustness test of radiomic features should be conducted before modeling.
Our study provided the insight into the robustness of radiomic features in the combined left and right parotid glands of HNC radiotherapy patients based on CT-contrast images. The limitations of this study included a relatively small sample size compared to the number of features and a limited number of observers from a single institution. These limitations may lead to problems related to observer diversity and potential biases in the results. Another limitation was that despite using the same CT scanner and imaging protocol for all patients, the amount of the contrast agent varied with the patient weight, ranging from 50 to 70 cm3. This variation could introduce variability of the radiomic features in addition to the delineation variability. Despite these limitations, it is important to recognize that our findings contributed to the understanding of interobserver variability in manual segmentation and auto-segmentation. The outcomes of this study provided a foundation for further research in development of NTCP modeling, where robust and weakly correlated radiomic features are desired.
In conclusion, from 107 radiomic features extracted from parotid gland contours of 20 HNC patients who underwent radiotherapy, we found that the majority of the shape features extracted from parotid gland contours were found to be robust but also mostly correlated, while most of the first-order and texture features were observed to be susceptible to delineation variability. The level of robustness did not change significantly when comparing manual segmentation by a single radiation oncologist or AI-based auto-segmentation with the actual clinical data, for which treating radiation oncologists were responsible for organ delineation.
Notes
Statement of Ethics
This study was approved by Human Research Ethics Committee, Chulabhorn Royal Academy (Project Code EC 026/2566).
Conflict of Interest
No potential conflict of interest relevant to this article was reported.
Funding
Kanyapat Buasawat acknowledges the Scholarship for Commemoration of the 60th Birthday of Her Royal Highness Princess Chulabhorn Krom Phra Srisavangavadhana for Development of Medical Physicists, Chulabhorn Royal Academy, Thailand (Contract No. 64/01). This research project is partially supported by Chulabhorn Royal Academy, Thailand (Fundamental Fund: fiscal year 2023 by National Science Research and Innovation Fund (FRB660044/0240 Project code 180856).
Author Contributions
Conceptualization, Buasawat K, Liamsuwan T, Chamchod S, Fuangrod T; Investigation and methodology, Buasawat K, Liamsuwan T, Chamchod S, Fuangrod T, Suntiwong S; Data curation, Buasawat K; Writing of the original draft, Buasawat K, Liamsuwan T; Reviewing and editing, Buasawat K, Liamsuwan T, Chamchod S, Fuangrod T, Suntiwong S.
Data Availability Statement
The data supporting this study's findings are available from the corresponding author upon reasonable request.